 Linux
Kernel Debugging Linux
Kernel Debugging
Evan Sarmiento
Although understanding how to implement and maintain various services
is critical to systems administration, it is also important to have
an understanding of the underlying operating system. When working
with the Linux kernel, especially the recent development kernels
(2.5), knowledge of how to debug the running system is critical.
The debugging techniques described in this article can help you
pinpoint specific problems within the Linux kernel. With this information,
you can fix the kernel and notify the Linux kernel mailing list.
When the Linux kernel crashes, it is called a panic. Debugging
a panicked kernel can reveal hardware problems on the system that
might not be seen otherwise. A panic occurs whenever the Linux kernel
executes the panic() function. Panic() is usually
called from within a kernel function when data, having been accessed,
does not meet expectations of the running kernel. For example, when
a memory cache for UIDs (User IDs) is created within the function
uid_cache_init(), the kernel panics if the memory is not
properly allocated. This panic may be invoked for a number of reasons.
Your system may not have enough memory to allocate the cache or,
more likely, it indicates that your memory is damaged.
Debuggers
Using a debugger can help you to determine how the kernel reached
the panic. It is possible to trace the path the kernel took to execute
the function uid_cache_init(). Debugging can also allow you
to examine CPU registers, variables, etc. that are active within
the running system.
When a kernel panics, an OOPS message is displayed on the screen.
The OOPS message contains the following: the values of the CPU registers,
the address of the function that invoked the panic, the stack, and
the name of the current process executing. By using this OOPS statement,
you can begin to debug the specific problem in the kernel. However,
sometimes this OOPS message is insufficient.
There is no default online debugger within the kernel, however,
there are online debuggers available. The one that I prefer to use
is kdb. Kdb (from SGI) comes as a kernel patch to any of the current
2.4.x kernels. When a panic arises, the user is dropped to a kdb
prompt, where you can examine registers, perform back traces, and
even alter the state of the system.
A third way to debug a Linux kernel is to perform a crashdump.
This, too, is implemented as a third-party patch. A dump is basically
a file that contains the entire state of the system when a panic
arises. This dump file includes all variables, registers, etc. on
the system at the time of the panic. You can access the dump file
using gdb or dd.
Another method for debugging a running system is through a serial
port. This method involves two computers -- the first computer
is the one that panics; the second computer is the one that performs
the actual debugging. The computers are connected to each other
via a serial cable.
This article assumes a very basic but working knowledge of the
C programming language and also assumes a familiarity with hexadecimal
numbers. It is also helpful to understand (but only on the simplest
level), basic x86 assembler commands -- mainly mov. In
this article, I will examine each method of debugging the Linux
kernel, using actual kernel bugs as examples.
Examining an OOPS Message
As stated before, when a kernel panic occurs, an OOPS message
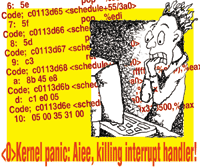
is printed on the screen. A typical OOPS message looks like Figure
1. The OOPS message in Figure 1 contains the following information:
the current CPU, the EIP (current instruction pointer), the values
of the registers, the stack, the call trace, and the currently executing
code. The two most important values in this OOPS are the EIP (current
instruction pointer) and the call trace. The EIP is the memory address
of the function that invoked the panic. The call trace shows the
steps taken to reach the offending function.
There are many ways to find the offending function. The easiest
way is if there is a panic message that accompanies the OOPS --
you can grep the kernel source for that string. Grepping
the kernel source for that string will usually help you pinpoint
the function in the kernel that caused the panic. However, more
than one function may use the same panic string. The most common
panic strings are "Aiee, killing interrupt handler!" and
"Attempted to kill init!" Therefore, grepping for these
strings will not be helpful, as they will only lead you to the function
do_exit() within exit.c in the kernel source.
The second way you can pinpoint the offending function is by grepping
your System.map for the EIP. The System.map contains the memory
addresses for all the symbols (registered kernel functions) within
the kernel. In Figure 1, the function at address c0113d5e is schedule().
This alone may explain much about the nature of the problem. The
problem may not reside in schedule(), but in a previous function
that somehow manipulates data incorrectly.
After finding the function that invokes panic(), schedule(),
the next step is to find all the functions leading up to schedule().
The addresses of these functions appear in the call trace section
of the OOPS message. Grepping for all these values would be tedious,
but fortunately there is a utility called ksymoops. Ksymoops, when
given an OOPS message, will resolve the addresses of the functions
to their names. Using ksymoops, I received the output in Figure
2.
As shown in Figure 2, each memory address is mapped to a function
name. You can now grep the Linux kernel source to either
find the problem, or use this as a bug report and send it to the
Linux kernel mailing list. The first line of the output (in Figure
2) says EIP, which is the name of the function that caused the panic.
The other functions listed are those that are in the back trace.
The first function of the trace, init, is the function
that executes the function directly above it. This is useful because
it probably isn't the EIP that causes the actual bug, but one
of the functions that invoked it previously.
This method of debugging, even though it is more specific, still
leaves a vast amount of information to process. Locating the bug
within the code would be difficult. In order to efficiently find
the offending code, it would help to test sample code, and look
at memory addresses and assembler code while the system is actually
running. This can be done using kdb.
Kdb
Kdb is a Linux kernel debugging patch for the Linux kernel that
provides a means of accessing and examining kernel memory and data
structures while the system is running. Kdb is not a source-level
debugger, rather, you work with the actual assembly code. Kdb does
provide a number of benefits: it does not require a second computer
to be used as the debugger; it allows for single stepping a processor,
stopping upon execution of a specific function (breakpoints), in
addition to other helpful features.
Breakpoints, in particular, are useful for diagnosing problems
in the Linux kernel. A breakpoint is a marker that is placed on
a specific instruction. When that marked instruction is executed,
the kernel traps into the debugger. The following section will detail
how to install, compile, and use kdb.
Kdb is essentially a patch for the Linux kernel. To begin, download
the appropriate version of kdb for your kernel:
ftp://oss.sgi.com/projects/kdb/download/
You must download two files: a -common file and an architecture-dependent
file. Be sure to examine the README file in the top of the directory.
This test system uses Linux 2.4.19 with kdb 2.3.
After downloading the appropriate bzip2 file, unzip it and execute
the following commands:
- cd /path/to/linux/source/tree -- Usually /usr/src/linux
- patch -p1 < kdb-xxx-common-n -- Where you replace
xxx with the version number of kdb
- patch -p1 < kdb-xxx-arch-n
- make mrproper && make menuconfig -- Be sure
you back up your old config before you do make mrproper.
If you do not make mrproper before make oldconfig,
sometimes the build will fail. It all depends on the status of
your source tree. Remember to do a make mrproper, a make
oldconfig, and a make menuconfig or config,
etc.
For debugging to work properly, enable the following options in
your kernel config file by setting each to "y": CONFIG_DEBUG_HIGHMEM,
CONFIG_DEBUG_SLAB, CONFIG_DEBUG, IOVIRT, CONFIG_DEBUG_SPINLOCK,
CONFIG_FRAME_POINTER, CONFIG_KDB, CONFIG_KDB_MODULES. Compile the
kernel and reboot.
In Figure 3, a bug is deliberately introduced into the Linux kernel.
When the kernel panics, the kernel will drop into kdb, and it will
be shown how to debug the actual problem using the features of kdb.
I introduced the bug into the system call sys_kill() by just
modifying a few lines in signal.c. When sys_kill()
is invoked, the kernel will panic, dropping us to kdb. sys_kill()
will then be debugged using kdb.
As you can see, I commented out the lines that fill the info
struct and I made info a NULL pointer -- sys_kill
will pass kill_something_info a NULL pointer. When the kernel
tries to access info in any manner, the kernel will panic.
After recompiling the kernel with this modification, the kernel
did indeed panic:
Enabling swap space:
Unable to handle kernel NULL pointer dereference at virtual address 0000002d
*pde = 00000000
Oops: 0000
CPU: 0
EIP: 0010:[<c0125466>] Not tainted
EFLAGS: 00000206
eax: 00000025 ebx: c7916000 ecx: c7916000 edx: 00000025
esi: 00000000 edi: ffffffff ebp: c7951f60 esp: c7951f58
ds: 0018 es: 0018 ss: 0018
Process rc.sysinit (pid: 160, stackpage=c7951000)
Stack: c7916000 0000000f c7951f84 c012580b 0000000f 00000025 c7916000
c7fd68a0 00000025 00000000 0000000f c7951fa8 c0125ce6 0000000f
00000025 c7916000 00000001 c7950000 00000000 0000000f c7951fbc
c0126791 0000000f 00000025
Call Trace: [<c012580b>] [<c0125ce6>] [<c0126791>] [<c010928b>]
Code: 8b 58 08 85 db 7f 6f 83 7d 08 12 75 5 8b 91 88 00 00 00 b8
Entering kdb (current=0xc7950000, pid 168) on processor 0 Oops: Oops
due to oops @ 0xc0125466
eax = 0x00000025 ebx = 0xc7916000 ecx = 0xc7916000 edx = 0x00000025
esi = 0x00000000 edi = 0xffffffff esp = 0xc7951f58 eip = 0xc0125466
ebp = 0xc7951f60 xss = 0x00000018 xcs = 0x00000010 eflags = 0x00000206
xds = 0x00000018 xes = 0x00000018 origeax = 0xffffffff ®s = 0xc7951f24
[0]kdb>
This appears to be a normal OOPS message. However, at the end of the
OOPS message, the user is dropped to a kdb prompt where you can actively
debug the system. As with a normal OOPS message, you can see that
the instruction causing the panic was at c0125466. If you want
to see the name of the function that actually caused the panic, you
can perform a back trace by executing:
[0]kdb> bt

EBP         EIP
0xc7a5ff60  0xc0125466  bad_signal+0x16 (0xf, 0x25, 0xc78c6000, 0xc7fd66f4, 0x25)
                            kernel .text 0xc0100000 0xc0125450 0xc01254f0
0xc7a5ff84  0xc012580b  send_sig_info+0x2b (0xf, 0x25, 0xc78c6000, 0x1, 0xc7a5e000)
                            kernel .text 0xc0100000 0xc01257e0 0xc01258f0
0xc7a55fa8  0xc0125ce6  kill_something_info+0x186 (0xf, 0x25, 0xa1)
                            kernel .text 0xc01000000 0xc0125b60 0xc0125d00
0xc7a5ffbc  0xc0126791  sys_kill+0x11 (0xa1, 0xf, 0xa1, 0x0, 0xf)
                            kernel .text 0xc01000000 0xc0126780 0xc01267a0
            0xc010928b  system_call+0x33
                            kernel .text 0xc0100000 0xc0109258 0xc0109290
The first function executed was system_call(). This makes sense.
When any system call in Linux is invoked, the first function executed
within kernel space is system_call(). From within system_call(),
sys_kill() is executed. Within the parentheses of sys_kill()
are the values of the arguments passed. The first step is to gather
the function prototypes of all the functions starting from sys_kill().
1. asmlinkage long sys_kill(int pid, int sig);
2. static int kill_something_info(int sig, struct siginfo *info,
int pid)
Something isn't right. It is evident that the second argument
to kill_something_info() should be a pointer. However, in
the back trace, the argument to kill_something_info() is
a hexadecimal number and not a memory address like it should be.
This means that the problem resides with the second argument that
is used in kill_something_info(). Looking at the source code
for sys_kill(), it is obvious that sys_kill() is passing
a NULL pointer to kill_something_info().
There are other ways this problem could be investigated by using
more advanced features of kdb. Kdb allows you to modify and examine
registers and memory addresses within the running kernel. Looking
at the back trace again, the kernel panics on instruction 0xc0125466.
It is possible to look at the exact code executed at 0xc0125466
by using the following command:
[0]kdb> id 0xc0125466

0xc0125466 bad_signal+0x16    mov    0x8(%eax), %ebx.
This is the problem instruction -- the memory address of %eax
is being assigned to %ebx. If you try to access the memory
pointed to by %eax:
[0]kdb> md %eax
0x00000024 kdb_getarea: Bad address 0x24
you can see that %eax actually points to nothing. Remember
that in kill_something_info, the value of the second argument
was 0x25. If you check the values of the current registers by executing:
[0]kdb> rd

eax = 0x00000025 ...
eax is shown to have the value of 0x00000025. This is
the same value used in kill_something_info. Now it is clear
that the problem resides with the argument placed within the eax
register.
Kdb can also be used for general debugging; it has the ability
to single step. You can enable a breakpoint by using the command:
[0]kdb> bp [vaddr]
where vaddr is the virtual address of the function. One can
also use the name of the function for vaddr. More specifically,
you can name an exact instruction within a function where it should
break by executing the following as:
[0]kdb> bp [function+0xAB]
where "AB" is an appropriate hexadecimal number.
The online help function, which can be accessed by typing:
[0]kdb> ?
is very useful. It describes all of kdb's commands and uses in
a terse format.
In the next section, I will attack this same problem using Linux
crash dumps and then using a source-level remote debugger (kgdb).
Dumping Core with LKCD
LKCD stands for "Linux Kernel Crash Dump". It is a patch
against the Linux kernel that dumps kernel memory into a file for
analyzing at a later time. This way you can debug the kernel while
remaining in user mode. It also allows you to send a crash dump
to the appropriate party to analyze if it is required.
This section will detail how to install, configure, and use LKCD.
I will use LKCD to debug the same problem detailed in the previous
section.
Download the appropriate patch for your Linux kernel:
http://lkcd.sourceforge.net/download/
Be sure to also download the appropriate lkcdutils RPM. (I
suggest downloading the SRC rpms and rebuilding them when it is necessary.)
After downloading the patch, apply it:
cd /usr/src/linux
patch -p1 < patch
After applying the patch, do a make menuconfig, enabling all
of the options under Kernel Debugging. Once the kernel is done compiling,
a file named Kerntypes will be created within the source tree. Be
sure to move this file, Kerntypes, into /boot and then replace /boot/System.map
with the System.map in the source tree:
cp /usr/src/linux/Kerntypes /boot
cp /boot/System.map /boot/System.map.old
cp /usr/src/linux/System.map /boot
Look at /etc/inittab; the file that is mentioned after the line "#
System initialization" will be edited (right after the lines
"action $"Mounting local filesystems:..." add the
lines "/sbin/lkcd config".
If you are using a swap partition as the dump device, the dump
must be saved before the swap is activated. Therefore, before the
swap is activated in the initialization file, add the lines:
/sbin/lkcd config
/sbin/lkcd save
Make a symbolic link from your dump device (where the dump will be
stored) to /dev/vmdump. For example:
ln -s /dev/hdb1 /dev/vmdump
Then execute:
/sbin/lkcd config
and reboot.
For more information on testing LKCD, look at the LKCD Web site:
http://lkcd.sourceforge.net)
There are a few good guides under the Documentation section of the
Web site.
You can analyze an actual crash dump using lcrash, a utility that
comes with the LKCD utils RPM. Lcrash is a lot like kdb. When the
kernel panics and you execute /sbin/lkcd save, the dumpfile
is saved in /var/log/dump/n, where n is any integer. You can start
analyzing the dump file by executing /sbin/lcrash -x n, where
n is the number of the dump. You will be dropped to a prompt similar
to kdb. You can use most of the kdb commands (except for single
stepping) in lcrash.
Conclusion
Kernel debugging is becoming increasingly important. It is useful
to be able to understand OOPS messages to help determine the actual
problem visually or with one of the utilities mentioned in this
article. It helps speed the Linux development process, and allows
you to become familiar with the systems you are running.
Evan Sarmiento is an eleventh-grade student at Boston University
Academy. He enjoys FreeBSD kernel hacking and network administration.
He can be contacted at: evms@bu.edu.
| 
